Youth
Youth, Usual mode of transportation to school
- Among Ottawa students in Grades 7 to 12, one in five (18%) usually used active transportation (i.e. walked or biked) to get to school in 2017. This proportion is comparable to the Ontario-less-Ottawa average of 19% (Table 1). [4]
Table 1. Percent of Ottawa students (Grades 7 to 12) reporting their usual mode of transportation to school, 2011 to 2017
| Primary Mode of Transportation to School |
2011 Percent (95% Confidence Interval) |
2013 Percent (95% Confidence Interval) |
2017 Percent (95% Confidence Interval) |
2017 Ontario-less-Ottawa Percent (95% Confidence Interval) |
|---|---|---|---|---|
| Motorized (2011-2013) | 79.0% (71.0-85.3) | 73.6% (70.6-76.6) | - | - |
| Car (2017) | - | - | 23.2% (19.1-27.9) | 32.8% (28.7-37.2) |
| School bus (2017) | - | - | 31.2% (21.7-42.7) | 38.6% (31.7-46.0) |
| Public transit (2017) | - | - | 22.1%* (13.2-34.5) | 6.7%* (4.1-10.8) |
| Active (walk, bike) | 20.4%* (14.3-28.3) | 25.0% (22.0-27.9) | 17.8% (13.8-22.7) | 18.9% (15.6-22.7) |
| Other | - | - | 4.4%* (2.5-8.7) | 2.0% (1.7-2.4) |
Data Source and Notes for Table 1
Youth, Past week active transportation to school, work or other places
-
84% of Ottawa youth, aged 12 to 17, reported being active to get to school, work or other places at least once in the past week in 2017, similar to Ontario-less-Ottawa (79%) (Table 2a and Figure 1). [5]
- Of those Ottawa youth who report active transportation, 90% report that they spent at least 45 minutes per week in active transportation and half reported at least 240 minutes (4 hours) per week of active transportation (Table 2b).
Table 2a. Percent of youth (12 to 17 years) reporting active transportation in the past week in Ottawa and Ontario-less-Ottawa in 2015/16 and 2017
| Report using active modes of transportation in the past week |
2015-16 Percent (95% Confidence Interval) |
2017 Percent (95% Confidence Interval) |
|
Ottawa |
74.5% (62.2-83.8) |
84.2% (67.2-93.2) |
|
Ontario-less-Ottawa |
78.6% (75.9-81.1) |
78.9% (74.8-82.5) |
Table 2b. Amount of time (minutes) per week that youth (12 to 17 years) report active transportation in Ottawa in 2015/16 and 2017, by percentiles
|
Percentile of youth who report active transportation (Interpretation)
|
Amount of time (minutes) per week in active transportation, 2015-16 (95% confidence interval) |
Amount of time (minutes) per week in active transportation, 2017 (95% confidence interval) |
|
10th percentile (90% of youth who report active transportation spend at least this amount of time per week actively travelling) |
20 minutes (9.2 to 30.8 minutes) |
45 minutes (15.6 to 74.4 minutes) |
|
20th percentile (80% of youth who report active transportation spend at least this amount of time per week actively travelling) |
50 minutes (10.8 to 89.2 minutes) |
105 minutes (53.6 to 156.4 minutes) |
|
50th percentile (50% of youth who report active transportation spend at least this amount of time per week actively travelling) |
150 minutes (101 to 199 minutes) |
240 minutes (137.1 to 342.9 minutes) |
Data Source and Notes for Table 2a – b
Ottawa Public Health. Canadian Community Health Survey 2017. Ontario Share File. Statistics Canada
Ottawa Public Health. Canadian Community Health Survey 2015/16. Ontario Share File. Statistics Canada
- The Canadian Community Health Survey (CCHS) is an annual national population health survey conducted by Statistics Canada.
- Youth respondents (12-17 years) were asked if in the last 7 days, did they use active ways like walking or cycling to get to places such as school, day camps, work, or to visit friends. Respondents were instructed not to include activity done for leisure.
- Youth respondents were asked to report the total amount of time in active transportation in minutes overall for the last week.
*Interpret with caution – high sampling variability.
Adults
Adults, Past week active transportation to work, school or other places
- 57% of Ottawa adults (aged 18+ years) report active transportation in the past week in 2017, which is higher than in Ontario-less-Ottawa (48%) (Figure 1). [5]
- Adults aged 18 to 44 years were more likely (70%) to report active transportation in the past week, compared to those aged 45 to 64 years (55%) and 65+ years (54%) (Figure 1).
- Three in ten (31%) of Ottawa adults (aged 18+ years) reported active transportation on five or more days in the past week (Figure 1). Compared to Ontario-less-Ottawa, more Ottawa residents used active transportation for 3 to 4 and 5 or more days (Table 3b).
- Among adults who reported active transportation in 2017, 90% spent at least 15 minutes per day in active transportation and half spent at least 40 minutes per day (Table 3c).
Figure 1. Percentage reporting active transportation by age and number of days in
the past week, Ottawa and Ontario-less-Ottawa, 2017
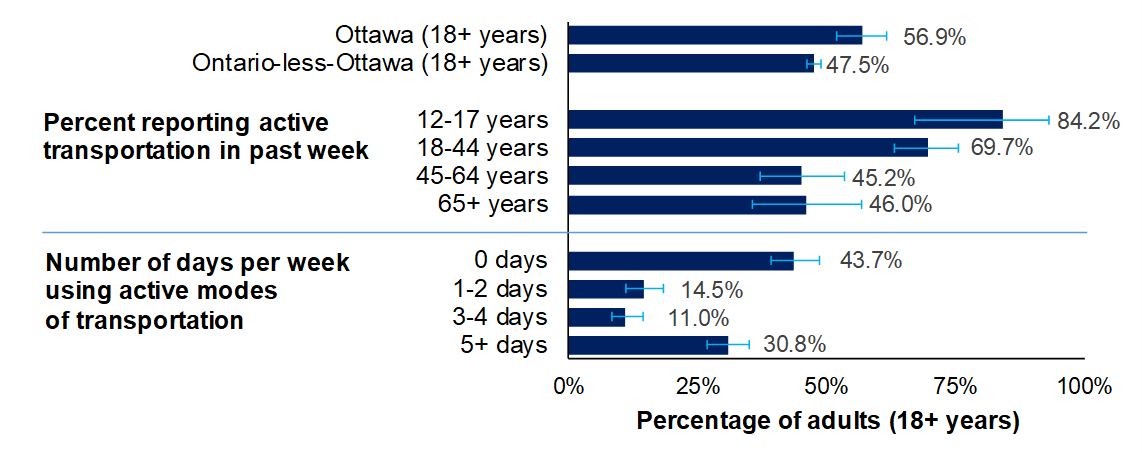
Table 3a. Percent of adults (18+ years) reporting active transportation in the past week in Ottawa and Ontario-less-Ottawa in 2015/16 and 2017
|
Report using active modes of transportation in the past week |
2015-16 Percent (95% Confidence Interval) |
2017 Percent (95% Confidence Interval) |
|
Ottawa |
57.4% (53.7-61.1) |
56.9% (52.0-61.6) |
|
Ontario-less-Ottawa |
46.7% (45.7-47.7) |
47.5% (46.1-49.0) |
Table 3b. Number of times in past week that adults (18+ years) report active transportation in Ottawa and Ontario-less-Ottawa in 2015/16 and 2017
| Number of days in past week used active transportation |
Ottawa Percent (95% Confidence Interval)2015-16 |
Ottawa Percent (95% Confidence Interval)2017 |
Ontario-less-Ottawa Percent (95% Confidence Interval)2015-16 |
Ontario-less-Ottawa Percent (95% Confidence Interval)2017 |
|
0 days |
42.6% (39.0-46.3) |
43.7% (39.1-48.5) |
54.1% (53.1-55.1) |
53.4% (52.0-54.9) |
|
1-2 days |
13.4% (11.3-15.9) |
14.5% (11.2-18.4) |
12.3% (11.7-13.0) |
13.1% (12.2-14.2) |
|
3-4 days |
12.0% (9.7-14.7) |
11.0% (8.3-14.5) |
8.5% (8.0-9.1) |
8.6% (7.8-9.5) |
|
5+ days |
31.5% (28.2-34.9) |
30.8% (26.8-35.1) |
24.9% (23.9-25.8) |
24.7% (23.3-26.0) |
Table 3c. Amount of time (minutes) per day that adults (18+ years) report active transportation in Ottawa in 2015-16 and 2017, by percentiles
|
Percentile of adults who report active transportation (Interpretation) |
Amount of time (minutes) per day in active transportation, 2015-16 |
Amount of time (minutes) per day in active transportation, 2017 |
|
10th percentile (90% of adults who report active transportation spend at least this amount of time per day actively travelling) |
13 minutes/day |
15 minutes/day |
|
20th percentile (80% of adults who report active transportation spend at least this amount of time per day actively travelling) |
20 minutes/day |
20 minutes/day |
|
50th percentile (50% of adults who report active transportation spend at least this amount of time per day actively travelling) |
30 minutes/day |
40 minutes/day
|
Data Source and Notes for Figure 1, Table 3a – c
Ottawa Public Health. Canadian Community Health Survey 2017. Ontario Share File. Statistics Canada
Ottawa Public Health. Canadian Community Health Survey 2015/16. Ontario Share File. Statistics Canada
- The Canadian Community Health Survey (CCHS) is an annual national population health survey conducted by Statistics Canada.
- Adult respondents were asked if in the last 7 days, did they use active ways like walking or cycling to get to places such as work, school, the bus stop, the shopping centre or to visit friends. Respondents were instructed not to include activity done for leisure.
- Adult respondents were asked to report the total amount of time in active transportation in minutes each day in the last week.
- Error bars represent 95% confidence intervals.
- *Interpret with caution – high sampling variability.
Data Table for Figure 1
Data presented in Figure 1 are found in Table 2a, Table 3a and Table 3b.
Adults, Primary mode of transportation to work
- 10% of employed Ottawa residents aged 15 years and older reported that their primary mode of transportation to work was walking or cycling in 2016. This proportion has remained steady over the past 15 years (Table 4).
Table 4. Primary mode of transportation to work, Ottawa adults aged 15+ years, 1996 to 2016
|
Primary Mode of Transportation to Work |
1996 |
2001 |
2006 |
2011 |
2016 |
|
Car (Driver or Passenger) |
NA |
70.9% |
69.1% |
67.7% |
68.4% |
|
Public Transit |
19.3% |
20.1% |
21.2% |
21.8% |
20.6% |
|
Walk or Cycled |
10.2% |
9.5% |
9.8% |
9.5% |
10.0% |
|
Walked |
7.9% |
7.5% |
7.6% |
7.1% |
7.4% |
|
Cycled |
2.3% |
2.0% |
2.2% |
2.4% |
2.6% |
|
Other |
0.8% |
0.8% |
0.9% |
Not available |
1.0% |
Data Source and Notes for Table 4
Statistics Canada. Canadian Census of Population, 1996, 2001, 2006, 2016.
Statistics Canada. National Household Survey, 2011.