Concussions and Head Injuries Data

A concussion is a brain injury that causes changes in the way the brain functions. It can lead to symptoms that can be physical, cognitive, emotional, behavioural and/or related to sleep. A concussion may be caused either by a direct blow to the head, face, or neck or by a blow to the body that transmits a force to the head that causes the brain to move rapidly within the skull.


  • In 2016, 16,335 Ottawa residents visited a doctor in Ontario for a concussion or a head injury.
  • The rate of Ottawa patients visiting a doctor for a concussion or head injury more than doubled over the past 10 years from 691 per 100,000 population to 1710 per 100,000 population and is higher than the Ontario-less-Ottawa average rate (*Figure 4). 
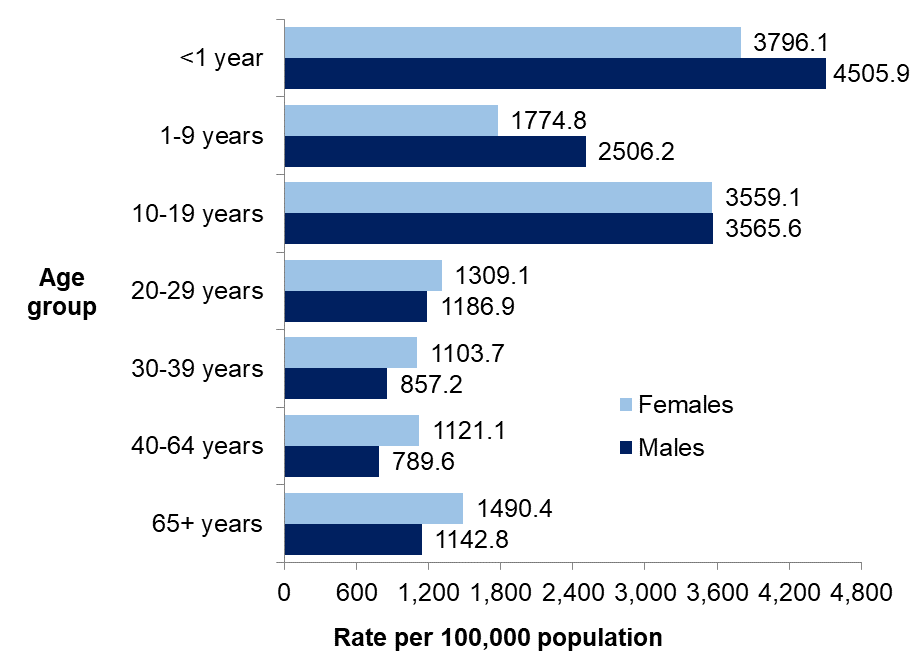
  • Infants (aged 0 to <1 year), followed by youth aged 10-19 years have the highest rate of concussion or head injury-related physician visits, followed by children aged 1-9 years (*Figure 5). 

Figure 4. Rate of concussion and head injury-related doctor visits (all ages) in Ottawa and Ontario-less-Ottawa from 2003 to 2016
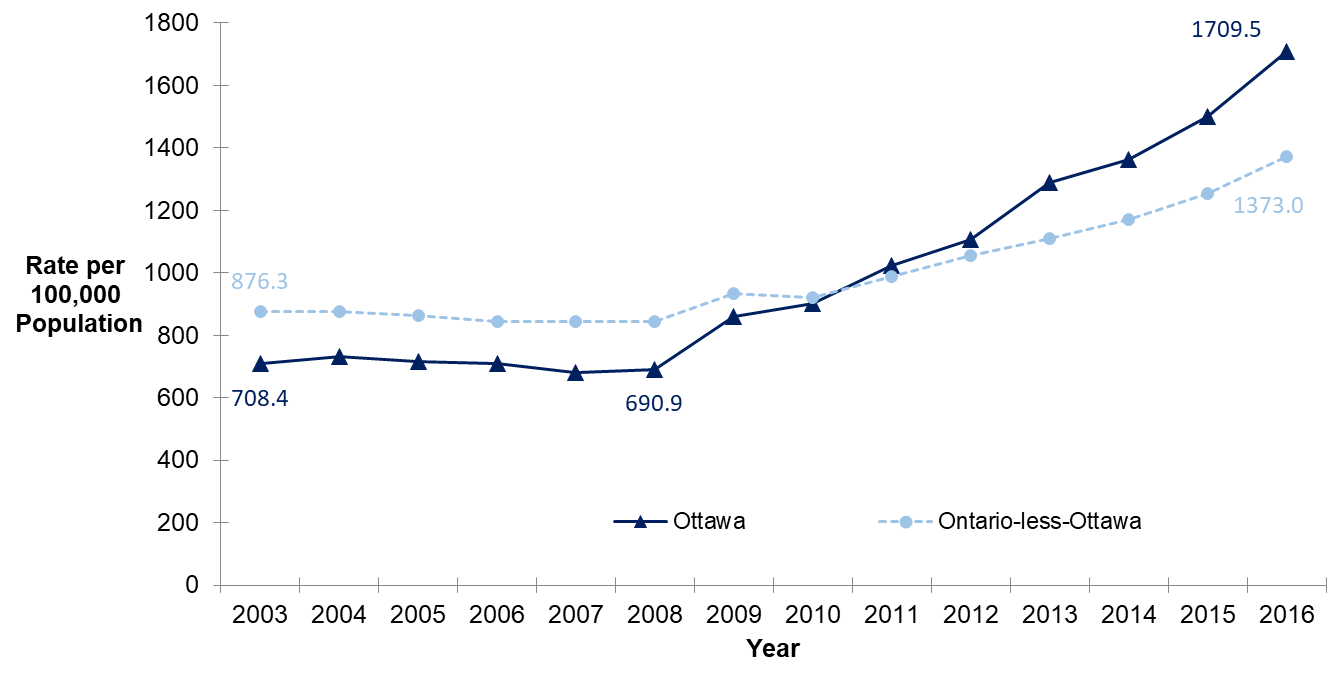
Rate of concussion and head injury-related doctor visits (all ages) in Ottawa and Ontario-less-Ottawa from 2003 to 2016

 Data Source and Notes for Figure 4

Patients of Ontario Physicians, Ontario Health Insurance Plan (OHIP) Approved Claim Files (2003-2016). Ontario Ministry of Health and Long-Term Care IntelliHEALTH Ontario. Extracted May 24, 2019.

  • Data include Ottawa and Ontario-less-Ottawa patients who visited a doctor in Ontario for a concussion or head injury.
  • OHIP diagnosis codes were used to categorize concussions (850) and head injuries (854).
  • Rates are age standardized to the 2011 Canadian population. The age standardized rate is not the actual rate (crude rate) in the population but a derived rate that is used for comparison with another population that might have a different age distribution.

 Data Table for Figure 4

Year

Ottawa rate (age standardized) of patients seeking concussion and head injury-related care from doctors (per 100,000 population)

Ontario-less-Ottawa rate (age standardized) of patients seeking concussion and head injury-related care from doctors (per 100,000 population)

2003

708.4

876.3

2004

732.1

877.2

2005

716.3

864.5

2006

710.4

845.3

2007

680.9

843.5

2008

690.9

843.2

2009

859.7

934.6

2010

901.6

920.7

2011

1021.8

988.6

2012

1105.1

1055.3

2013

1287.8

1108.2

2014

1361.1

1171.0

2015

1498.8

1254.5

2016

1709.5

1373.0

Figure 5. Average rate of concussion-related physician visits by sex and age group in Ottawa from 2014 to 2016
 Data Source and Notes for Figure 5

Patients of Ontario Physicians, Ontario Health Insurance Plan (OHIP) Approved Claim Files (2014-2016). Ontario Ministry of Health and Long-Term Care IntelliHEALTH Ontario. Extracted May 24, 2019.

  • Data include Ottawa and Ontario-less-Ottawa patients who visited a doctor in Ontario for a concussion or head injury.
  • OHIP diagnosis codes were used to categorize concussions (850) and head injuries (854).

 Data Table for Figure 5

Age group

Average female rate of concussion-related physician visits from 2014-2016 (per 100,000 females)

Average male rate of concussion-related physician visits from 2014-2016 (per 100,000 males)

<1 year

3796.1

4505.9

1-9 years

1774.8

2506.2

10-19 years

3559.1

3565.6

20-29 years

1309.1

1186.9

30-39 years

1103.7

857.2

40-64 years

1121.1

789.6

65+ years

1490.4

1142.8


  •  In 2018, there were over 2,800 emergency department (ED) visits by Ottawa residents for concussions.
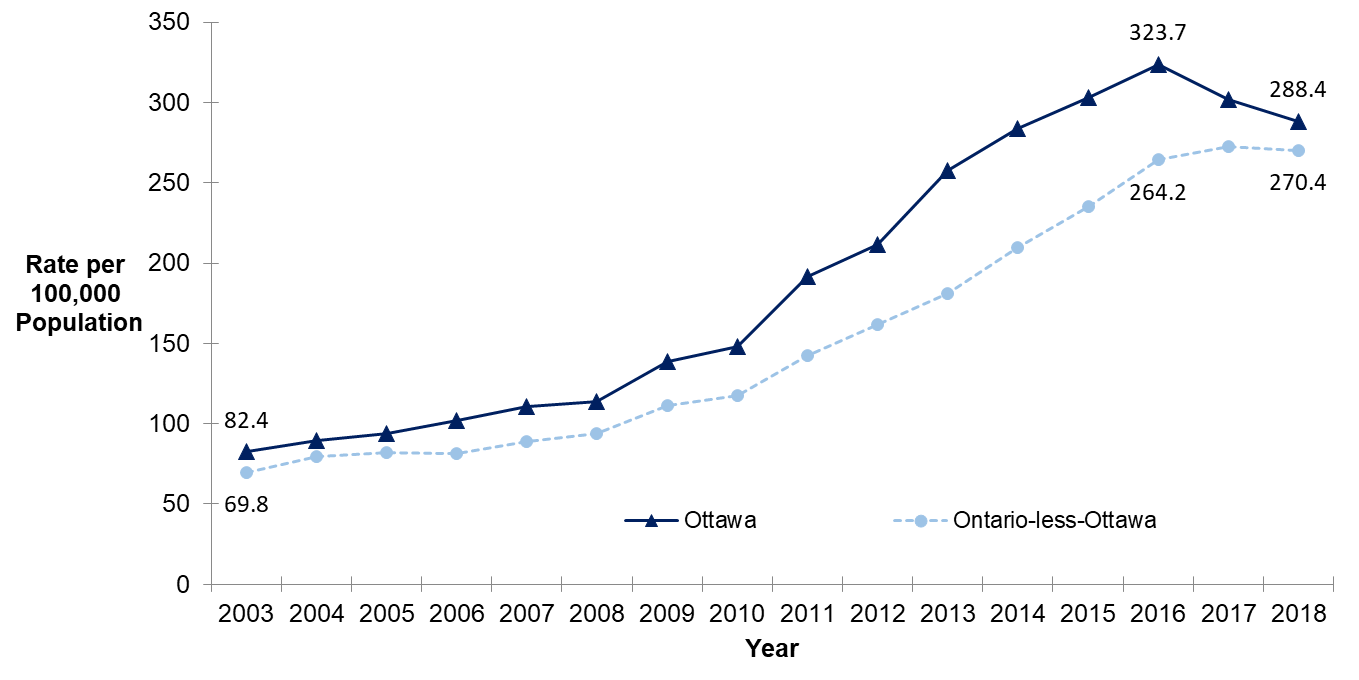
  • The rate of concussion-related ED visits among Ottawa residents nearly quadrupled in the past 15 years from 82 visits per 100,000 population in 2003 to a high of 324 visits per 100,000 population in 2016 (Figure 6).
  • The rate of concussion-related ED visits among Ottawa residents has consistently been higher than that of the Ontario-less-Ottawa average (Figure 6).
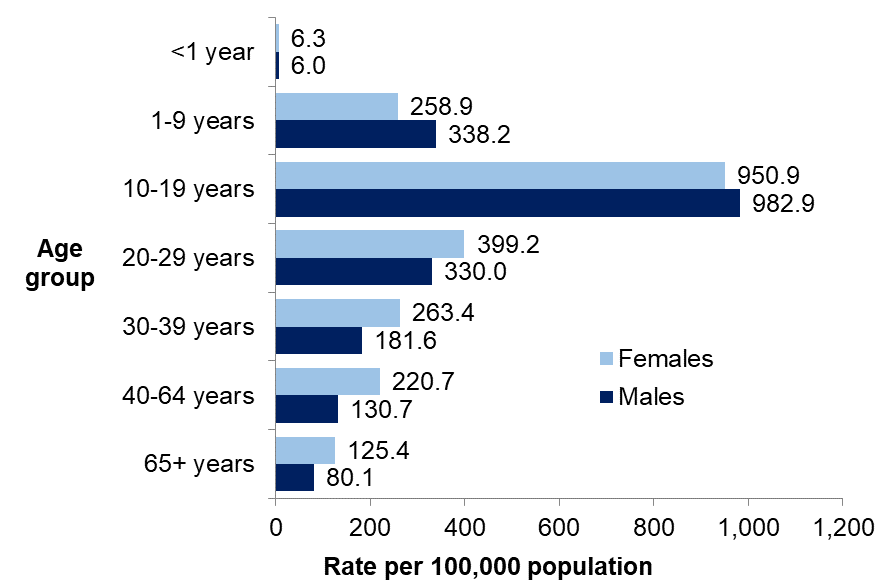
  • Youth aged 10-19 years have the highest rate of concussion-related ED visits, followed by adults aged 20-29 years and children aged 1-9 years (Figure 7).
  • Males aged 0-19 years had slightly higher rates of concussion-related ED visits compared to females, however this trend reversed for ages 20 years and older, where females had slightly higher concussion-related ED visits compared to males (Figure 7).
  • The most common cause for concussion-related ED visits were:
    1. Falls: representing approximately 4 in 10 (38%) concussion-related ED visits
    2. Motor vehicle traffic collisions: 1 in 10 (12%) of concussion related ED visits
    3. Hockey/ringette (6%)
    4. Rugby/football (4%)
    5. Soccer (3%)
    6. Cycling (3%)
    7. Ski or snowboarding (2%)
    8. Ice skating (2%)

Figure 6. Rate of concussion-related ED visits (all ages) in Ottawa and Ontario-less-Ottawa from 2003 to 2018

Year  Ottawa rate (age standardized) of ED visits for concussions (per 100,000 population)  Ontario-less-Ottawa rate (age standardized) of ED visits for concussions (per 100,000 population)  2003  82.4  69.8  2004  89.3  79.3  2005  93.9  81.8  2006  101.7  81.6  2007  110.7  88.9  2008  114.0  94.0  2009  138.5  111.5  2010  148.3  117.4  2011  191.3  142.7  2012  211.6  161.9  2013  257.7  181.0  2014  283.8  209.4  2015  303.4  235.3  2016  323.7  264.2  2017  301.8  272.6  2018  288.4  270.4

 Data Source and Notes for Figure 6

Unscheduled emergency department visits, National Ambulatory Care System (2003-2018). Ontario Ministry of Health and Long-Term Care IntelliHEALTH Ontario. Extracted June 20, 2019.

  • Data include all Ottawa residents seen at an emergency department (ED) in Ontario. Injury events may have taken place outside of Ottawa.
  • The following ICD-10-CA code was used to categorize concussions: S06.0
  • Rates are age standardized to the 2011 Canadian population. The age standardized rate is not the actual rate (crude rate) in the population but a derived rate that is used for comparison with another population that might have a different age distribution.

 Data Table for Figure 6

Year

Ottawa rate (age standardized) of ED visits for concussions (per 100,000 population)

Ontario-less-Ottawa rate (age standardized) of ED visits for concussions (per 100,000 population)

2003

82.4

69.8

2004

89.3

79.3

2005

93.9

81.8

2006

101.7

81.6

2007

110.7

88.9

2008

114.0

94.0

2009

138.5

111.5

2010

148.3

117.4

2011

191.3

142.7

2012

211.6

161.9

2013

257.7

181.0

2014

283.8

209.4

2015

303.4

235.3

2016

323.7

264.2

2017

301.8

272.6

2018

288.4

270.4

Figure 7. Average rate of concussion-related ED visits by sex and age group in Ottawa, from 2016 to 2018

Average rate of concussion-related ED visits by sex and age group in Ottawa, from 2016 to 2018

Data Table for Figure 7 

Age group

Average female rate of concussion-related ED visits from 2016-2018 (per 100,000 females)

Average male rate of concussion-related ED visits from 2016-2018 (per 100,000 males)

<1 year

6.3

6.0

1-9 years

258.9

338.2

10-19 years

950.9

982.9

20-29 years

399.2

330.0

30-39 years

263.4

181.6

40-64 years

220.7

130.7

65+ years

125.4

80.1

Parent Reported Concussions Among Children and Youth

  • In 2018, one in four (25%) Ottawa parents report that at least one child (aged 5 to 17 years) has ever had a concussion. [5]

Lifetime Head Injury

  • 35% of Ottawa students (grades 7-12) reported having a head injury at some point in their lifetime that resulted in a headache, dizziness, blurred vision, vomiting, feeling confused or “dazed”, or memory problems. [6]
    • Boys were significantly more likely to report ever having a head injury compared to girls (boys: 39% vs. girls: 31%).
    • Students in Grades 7 to 8 were significantly more likely to report ever having a head injury than those in Grades 9 to 12 (Grade 7-8: 42% vs. Grade 9-12: 32%).
    • Non-immigrant students were significantly more likely to report ever having a head injury than immigrants (Canadian-born: 37% vs. immigrant: 29%).
    • There were no significant differences in the prevalence of reported lifetime head injuries between students in Ottawa and Ontario-less-Ottawa or by socioeconomic status

Past Year Head Injury

  • 16% of Ottawa students (Grades 7 to 12) reported having a head injury in the past year that resulted in a headache, dizziness, blurred vision, vomiting, feeling confused or “dazed”, or memory problems. [6]
    • One fifth (20%) of students in Grades 7 to 8 reported having a head injury in the past year which was significantly higher than for those in grades 9-12 (14%).

Ever had Traumatic Brain Injury

  • Nearly one in ten (9%) Ottawa students in Grades 7 to 12 reported ever having a head injury that resulted in them being knocked unconscious for at least 5 minutes or resulted in a hospital stay for at least one night (traumatic brain injury). [6]
    • Students in Grades 7 to 8 were more likely to report having a traumatic brain injury than those in Grades 9 to 12 (Grade 7-8: 11% vs. Grade 9-12: 8%).
    • There were no significant differences in estimates for students in Ottawa compared to Ontario-less-Ottawa, or by sex, immigration status or socioeconomic status.

Reason for Head Injury in the Past Year

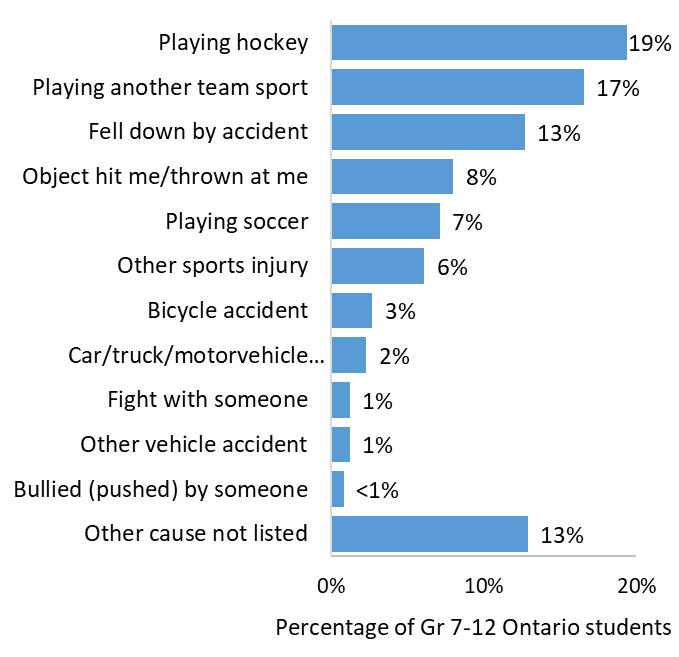
  • Playing hockey and other team sports (such as football, rugby) are among the most commonly reported causes of head injuries among Ontario students in Grades 7 to 12 (Ottawa data not available), followed by falling down, being hit by an object, playing soccer or from another sport (such as skiing, snowboarding or skateboarding) (Figure 8).

Figure 8. Main reason for a head injury in the past year among Ontario students in Grades 7 to 12, 2017

 Data Source and Notes for Figure 8

Boak, A., Hamilton, H. A., Adlaf, E. M., Henderson, J. L., & Mann, R. E. (2018). The mental health and well-being of Ontario students, 1991-2017: Detailed findings from the Ontario Student Drug Use and Health Survey (OSDUHS). Toronto, ON: Centre for Addiction and Mental Health.

  • ‘Another team sport’ includes football, rugby, basketball
  • ‘Other sports injury’ includes skateboarding, skiing, snowboarding
  • ‘Other vehicle’ includes snowmobile, ATV, tractor
  • Provincial data is presented as there was not enough sample to look at this detailed breakdown locally for Ottawa.

  Data Table for Figure 8

Main reason for a head injury in the past year

Ontario Percentage (%)

Playing hockey

19

Playing another team sport

17

Fell down by accident

13

Object hit me/thrown at me

8

Playing soccer

7

Other sports injury

6

Bicycle accident

3

Car/truck/motorvehicle accident

2

Fight with someone

1

Other vehicle accident

1

Bullied (pushed) by someone

<1

Other cause not listed

13

Ability to recognize the signs and symptoms of a concussion:

  • 35% of Ottawa parents were very confident and 52% were somewhat confident that they were able to recognize the signs and symptoms of a concussion in their child(ren). Thirteen percent were either not very or not at all confident that they were able to recognize the signs and symptoms of a concussion in their child(ren).  [5]

 Awareness about the importance of limiting certain cognitive activities following a concussion:

  • 77% of Ottawa parents said that it was very important and 14%* said that it was somewhat important for their child to limit activities such as reading, watching TV, playing electronic games, or attending school if they were told their child had a concussion. [5]

Awareness of “Return to Play Protocol”

  • 52% of Ottawa parents have heard of the “Return to Play Protocol” for children to safely return to activity or sport after having a concussion; 7%* thought that they might have heard of it and 41% said that they had not heard of the “Return to Play Protocol." [5]

Welcome to the new OttawaPublicHealth.ca

Ottawa Public Health has moved to a refreshed website. During this transition, some links, redirects, documents, pages or display features may be temporarily affected.

Your feedback will help us review and address issues during the stabilization period.