
Socio-demographic Data and Population Projections

This page outlines population characteristics for the Ottawa population, including origin and identity, language, education, employment and income, housing and shelter, and urban/rural living.
On this page:

Demographics and Population Projections

  • In 2023, an estimated 1,095,575 people live in Ottawa.[1] Males account for 49% of the population and females for 51%. [2]
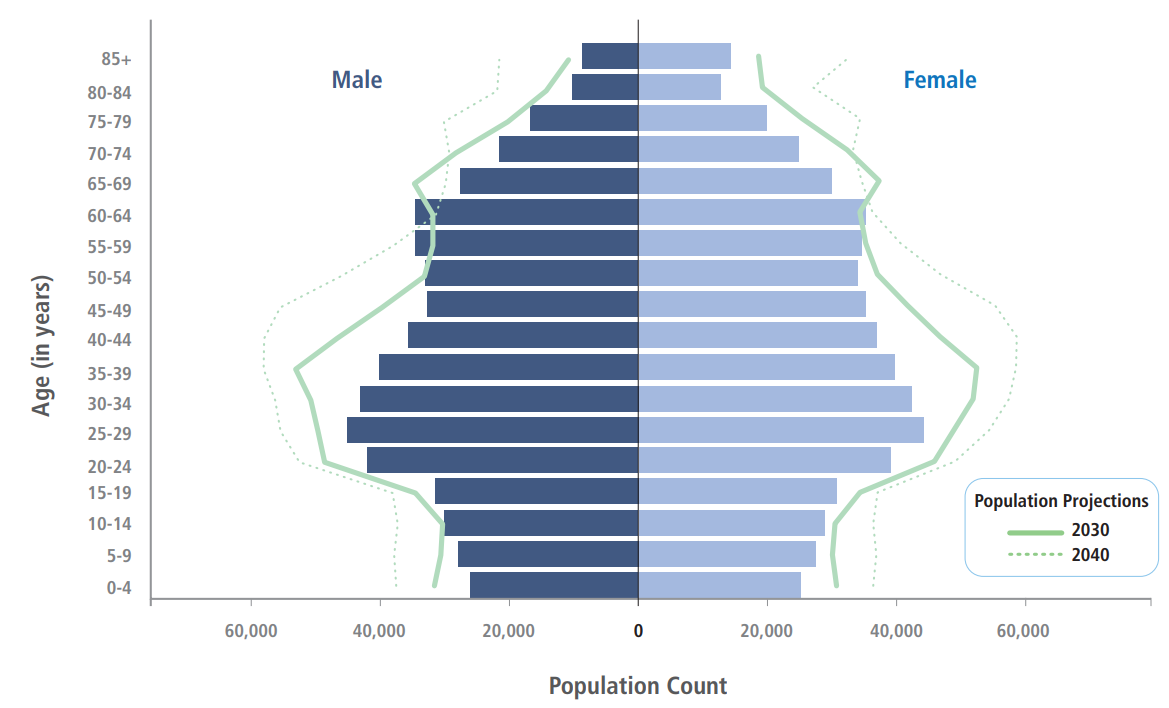
  • The median age of Ottawa residents is 39 years; 39 years for men and 41 years for women. [2] The estimated age distribution of the Ottawa population in 2023, 2030 and 2040 is detailed in Figure 1
  • In the coming decades, the greatest growth is projected to occur among those 20 to 49 and those 65 and over. By 2030, it is estimated that older adults, aged 65 and over, are projected to account for 20% of the population.[1]

Figure 1.  Population distribution as counts, for males and females, in Ottawa in 2023 and projections for 2030 and 2040

Figure 1., Population distribution as counts, for males and females, in Ottawa in 2023 and projections for 2030 and 2040.

Population Projections. Ottawa. Ontario Ministry of Health, IntelliHEALTH Ontario. Extracted January 27, 2023

*Note: The Ministry of Health enumerates population estimates for "males" and "females", not men and women

Table 1. Population distribution as counts, for males and females, in Ottawa in 2023, 2030 and 2040.
Age in Years Males in 2023 (#) Females in 2023 (#) Males in 2030 (#) Females in 2023 (#) Males in 2040 (#) Females in 2040 (#)
0-4 
 26,094  
 25,237  
 31,167  
 29,602  
 36,575  
 34,742  
5-9 
 27,893  
 27,503  
 30,267  
 29,039  
 36,855  
 35,176  
10-14 
 29,585  
 28,919  
 30,009  
 29,394  
 36,375  
 34,748  
15-19 
 31,506  
 30,736  
 33,846  
 32,901  
 37,101  
 35,383  
20-24 
 41,941  
 39,111  
 46,689  
 43,333  
 50,238  
 46,240  
25-29 
 45,132  
 44,251  
 47,645  
 46,068  
 52,933  
 51,027  
30-34 
 43,081  
 42,395  
 48,646  
 48,785  
 53,679  
 53,813  
35-39 
 40,126  
 39,689  
 50,808  
 49,276  
 55,309  
 54,801  
40-44 
 35,460  
 37,005  
 44,953  
 44,139  
 55,261  
 54,914  
45-49 
 32,537  
 35,253  
 38,572  
 39,587  
 52,950  
 51,857  
50-54 
 32,705  
 34,014  
 32,586  
 35,336  
 44,446  
 44,195  
55-59 
 34,553  
 34,668  
 31,389  
 33,695  
 36,983  
 38,615  
60-64 
 34,289  
 35,332  
 31,394  
 32,866  
 30,946  
 34,648  
65-69 
 27,641  
 30,075  
 34,020  
 35,598  
 29,570  
 33,126  
70-74 
 21,582  
 24,926  
 28,143  
 31,082  
 29,069  
 31,915  
75-79 
 16,656  
 19,861  
 20,799  
 24,785  
 29,857  
 32,899  
80-84 
 9,966  
 12,846  
 15,386  
 19,210  
 22,309  
 26,310  
85+ 
 8,619  
 14,388  
 12,219  
 18,653  
 22,003  
 31,559  

Origin and Identity

Indigenous Identity

  • In 2021, 3% of Ottawa residents identify as Indigenous, including First Nations (North American Indian), Métis or Inuk (Inuit), an increase from 2.5% in 2016. [2,3] While the Census provides an estimate of the Indigenous population in Ottawa, Indigenous identity is underestimated. [4]

Please refer to these reports for more information about Indigenous populations in Ottawa: Our Health CountsMy Life, My WellbeingDiversity Snapshot: Aboriginal Peoples.  

Racialized Groups

  • In 2021, 35% of Ottawa residents identified as racialized, a 7% increase compared to 2016 (28%). [2,3]
  • Black, Middle Eastern, and South Asian were the most frequently reported racialized groups. [2]

Immigration

  • About a quarter (26%) of Ottawa residents in 2021 were born outside of Canada, a slight increase from 2016 (24%).[2]
  • Five percent of Ottawa residents are recent immigrants (those who immigrated in the past five years).
  • Just over half (54%) of recent immigrants to Ottawa came from Asia, with India being the most frequently reported country of origin. [2]

Language

  • Almost all Ottawa residents can conduct a conversation in English or French. In 2021, 61% of people living in Ottawa spoke English only, 1% spoke French only, 36% spoke English and French, and 2% spoke neither English nor French. [2] This is not substantively different from the previous two censuses (Table 2). 
  • Nearly one quarter (23%) of people’s mother tongue is a language other than English or French. The top three mother tongue languages for people whose mother tongue is a language other than English or French are Arabic (16%), Chinese (12%), and Spanish (5%).  [2]
Table 2. Knowledge of official languages, Ottawa, 2011, 2016, 2021
Language Count in 2021 Percent in 2021 Percent in 2016 Percent in 2011
English Only 610,175 61% 59% 60%
French Only 14,275 1% 1% 1%
English and French 367,035 36% 38% 37%
Neither English nor French 15,480 2% 1% 1%

Statistics Canada. 2023. Ottawa, CV [Census subdivision], Ontario and Canada [Country] (table). Census Profile. 2021 Census of Population. Statistics Canada Catalogue no. 98-316- X2021001. Ottawa. Released February 8, 2023. https://www12.statcan.gc.ca/census-recensement/2021/dp-pd/prof/index.cfm?Lang=E (accessed March 8, 2023).

Statistics Canada. 2017. Ottawa, CV [Census subdivision], Ontario and Canada [Country] (table). Census Profile. 2016 Census. Statistics Canada Catalogue no. 98-316-X2016001. Ottawa. Released November 29, 2017. http://www12.statcan.gc.ca/census-recensement/2016/dp-pd/prof/index.cfm?Lang=E  (accessed November 29, 2017).

Statistics Canada. 2013. Ottawa, CV, Ontario (Code 3506008) (table). National Household Survey (NHS) Profile. 2011 Census. Statistics Canada Catalogue no. 99-004-XWE. Ottawa. Released June 26, 2013. http://www12.statcan.gc.ca/nhs-enm/2011/dp-pd/prof/index.cfm?Lang=E  (accessed October 27, 2017).

Education, Employment and Income

  • People in Ottawa are well-educated with three quarters (77%) of adults (aged 25 to 64 years) holding a postsecondary education certificate, diploma or degree, 18% hold a high school diploma or equivalent, and only 5% not having completed high school. This is a higher proportion that hold a postsecondary education (77% vs 75%) compared to 2016. [2]
  • Unemployment has improved since the earliest years of the pandemic. In 2022, monthly unemployment ranged from 3% to 6%, which is lower compared to the first two years of the COVID-19 pandemic (2020 monthly range: 4% to 10%; 2021 monthly range: 5% to 13%). [2]
  • The median after-tax individual income for people living in Ottawa over 15 years of age was $44,000 in 2020,18 up 18% from $37,136 in 2015. This increase exceeded cumulative inflation over the same time period (10%). [2]
  • The median after-tax household income was $88,000 in 2020, up only 2% from $85,981 in 2015. This increase was less than the rate of inflation.[2]
  • The estimated cost of living for a family of two adults and two children was $50,355 in Ottawa in 2021, a 9% increase over five years from 2017 ($46,123). This estimate, called the Market Basket Measure (MBM), considers the cost of clothing, food, footwear, transpor tation, shelter, and other expenses. [8]
  • Close to 89,000 individuals, or 9% of people in Ottawa, lived in low income in 2020, adjusting for household size using the after-tax low income measure (LIM-AT). This is a decrease from 13% in 2015. [2]
  • Ottawa residents aged 18 to 64 years were less likely to live in low income in 2020 (8%) than those aged 17 and under (11%) or individuals 65 years and older (9%). [2]

Housing and Shelter

  • In 2021, there were 407,250 private dwellings in Ottawa. About two-thirds (64%) of these dwellings are owned, while 36% are rented. The average monthly cost for owned dwellings is $1,668 and for rented dwellings is $1,422. [2]
  • One fifth (20%) of private households in Ottawa spent 30% or more of their household income on shelter costs in 2021. [2]
    • 14% of owner households spent 30% or more of their household income on shelter costs
    • 35% of tenant households (e.i., people who rent) spent 30% or more of their income on shelter costs; and
    • 14% of tenant households were in subsidized housing. [2]
  • The average household size in Ottawa was 2.5 people in 2021. [2]
    • One-person households made up 29% of households in Ottawa;
    • Almost one quarter (24%) of households were married or common-law couples with no children; and
    • 36% of households were couple or lone parents. [2]
  • In 2021, the family structure of Ottawa families was predominantly couples with (44%) or without (40%) children. Lone parents make up 16% of families in Ottawa, the majority of which are female lone parents (79%). [2]

Core housing need is a measure that considers suitability, adequacy and affordability of a dwelling. A household living in a dwelling that is unsuitable, inadequate or unaffordable, and whose income level would not allow alternative suitable and adequate housing is considered in a core housing need. [6]

  • In 2021, 11% of Ottawa households were in a core housing need. [2]
    • 5% of owner households were in core housing need; and
    • 23% of tenant households were in core housing need. [2]

Urban and Rural Population

  • All sub-areas in Ottawa experienced an increase in population growth in 2022 except Bayshore, which experienced a 0.3% decrease in population, and the Rural Northeast, which saw no change in population.
  • Within Ottawa, the largest population growth in 2022 took place in suburban areas outside the Greenbelt (3.1% growth from 2021), following the pattern of past years. [7]
  • n 2022, the percentage of Ottawa’s population living [7]:
    • downtown was 10.5% representing an estimated 112,290 people,
    • inside the Greenbelt but outside of downtown core was 52% representing an estimated 443,220 people,
    • in suburban areas outside the Greenbelt was 38.5% representing an estimated 411,220 people, and
    • in rural areas was 9.4% representing an estimated 100,570 people.

References

  1. Population Estimates 2023, Ontario Ministry of Health, IntelliHEALTH Ontario, Date Extracted: Jan 27, 2023.
  2. Statistics Canada. 2023. Ottawa, CV [Census subdivision], Ontario and Canada [Country] (table). Census Profile. 2021 Census of Population. Statistics Canada Catalogue no. 98-316- X2021001. Ottawa. Released February 8, 2023. https://www12.statcan.gc.ca/census-recensement/2021/dp-pd/ prof/index.cfm?Lang=E (accessed March 8, 2023).
  3. Statistics Canada. 2017. Ottawa, CV [Census subdivision], Ontario and Canada [Country] (table). Census Profile. 2016 Census. Statistics Canada Catalogue no. 98-316-X2016001. Ottawa. Released November 29, 2017. http://www12.statcan.gc.ca/census-recensement/2016/dp-pd/prof/index.cfm?Lang=E  (accessed November 29, 2017).
  4. City of Ottawa. Diversity Snapshot: Aboriginal Peoples (First Nations, Inuit, Métis). 2010.
  5. Statistics Canada. 2023. Ottawa. Table 14-10-0354-01 Regional unemployment rates used by the Employment Insurance program, three-month moving average, seasonally adjusted. https://www150.statcan.gc.ca/t1/tbl1/en/cv.action?pid=1410035401 Released Jan 6, 2023. (accessed February 2, 2023) 
  6. Statistics Canada. 2017. Core Housing Need, 2016 Census of Population, 2016001. Statistics Canada Catalogue no 98-509-X2016001. Ottawa. Version updated Nov 15 2017. Ottawa. [accessed Oct 16, 2018]  https://www12.statcan.gc.ca/census-recensement/2016/dp-pd/chn-biml/index-eng.cfm
  7. City of Ottawa. 2024. 2022 Annual Development Report. City of Ottawa, Planning, Development and Building Services [Accessed online Aug 15, 2025] https://documents.ottawa.ca/sites/default/files/annual_dev_report_2022_en.pdf
  8. Statistics Canada. 2023. Ottawa [CMA]. Table 11-10-0066-01 Market Basket Measure (MBM) thresholds for the reference family by Market Basket Measure region, component and base year. https://www150.statcan.gc.ca/t1/ tbl1/en/cv.action?pid=1110006601 Released January 17, 2023. (accessed February 1, 2023).

Welcome to the new OttawaPublicHealth.ca

Ottawa Public Health has moved to a refreshed website. During this transition, some links, redirects, documents, pages or display features may be temporarily affected.

Your feedback will help us review and address issues during the stabilization period.