- In 2016, 16,335 Ottawa residents visited a doctor in Ontario for a concussion or a head injury.
- The rate of Ottawa patients visiting a doctor for a concussion or head injury more than doubled over the past 10 years from 691 per 100,000 population to 1710 per 100,000 population and is higher than the Ontario-less-Ottawa average rate (*Figure 4).
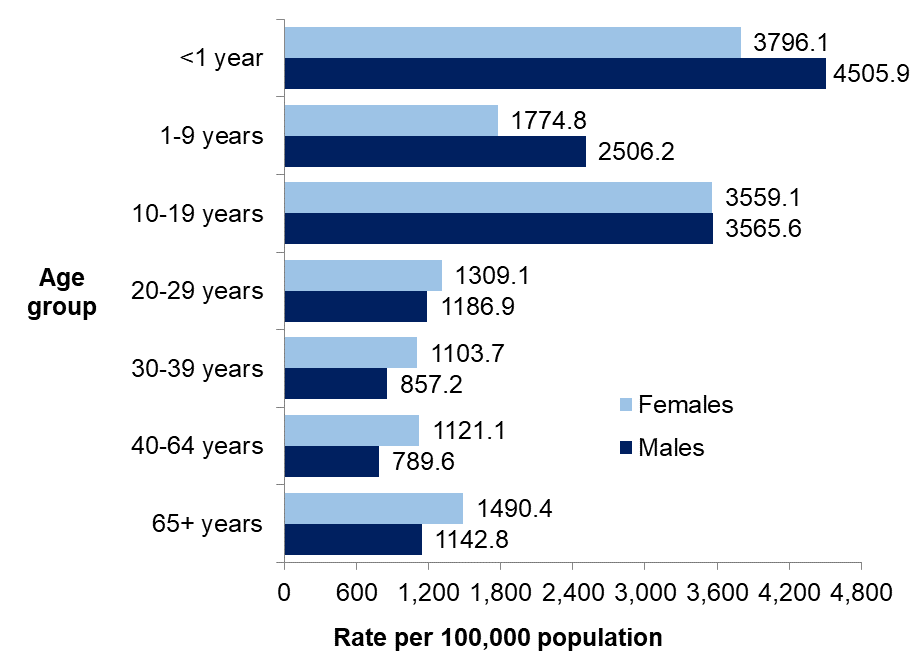
- Infants (aged 0 to <1 year), followed by youth aged 10-19 years have the highest rate of concussion or head injury-related physician visits, followed by children aged 1-9 years (*Figure 5).
Figure 4. Rate of concussion and head injury-related doctor visits (all ages) in Ottawa and Ontario-less-Ottawa from 2003 to 2016
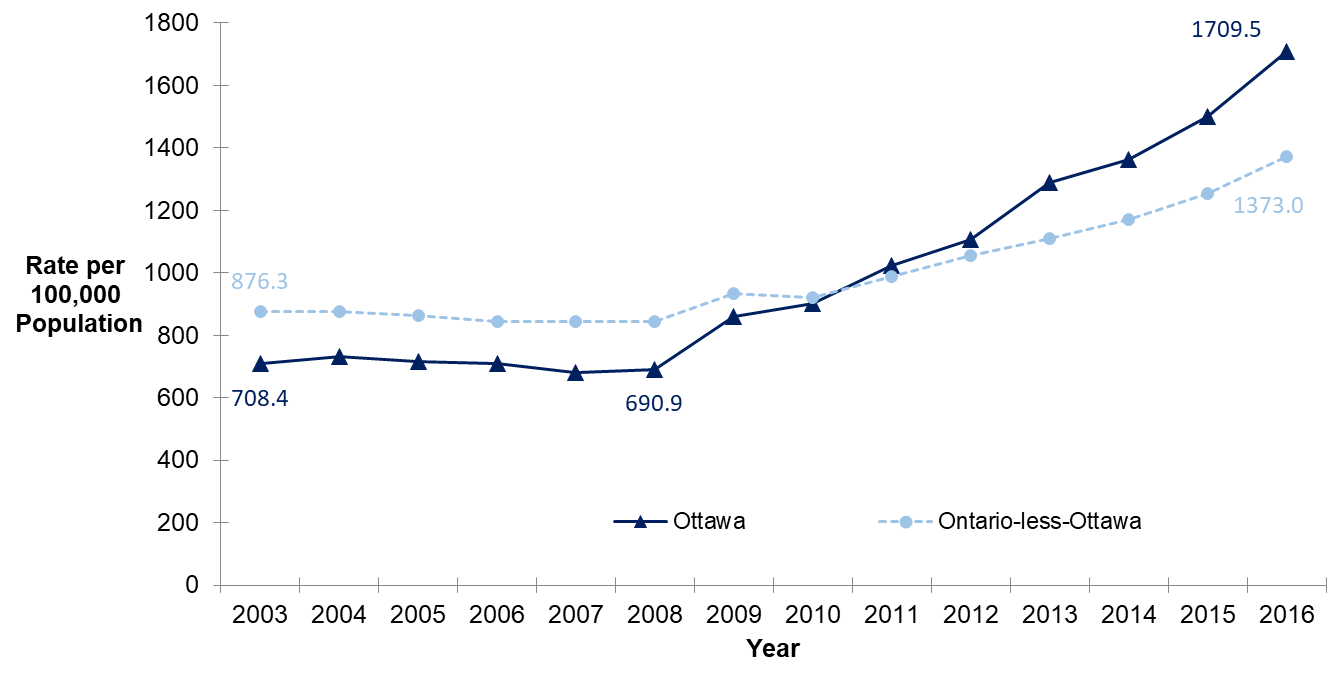
Data Source and Notes for Figure 4
Patients of Ontario Physicians, Ontario Health Insurance Plan (OHIP) Approved Claim Files (2003-2016). Ontario Ministry of Health and Long-Term Care IntelliHEALTH Ontario. Extracted May 24, 2019.
- Data include Ottawa and Ontario-less-Ottawa patients who visited a doctor in Ontario for a concussion or head injury.
- OHIP diagnosis codes were used to categorize concussions (850) and head injuries (854).
- Rates are age standardized to the 2011 Canadian population. The age standardized rate is not the actual rate (crude rate) in the population but a derived rate that is used for comparison with another population that might have a different age distribution.
Data Table for Figure 4
|
Year |
Ottawa rate (age standardized) of patients seeking concussion and head injury-related care from doctors (per 100,000 population) |
Ontario-less-Ottawa rate (age standardized) of patients seeking concussion and head injury-related care from doctors (per 100,000 population) |
|
2003 |
708.4 |
876.3 |
|
2004 |
732.1 |
877.2 |
|
2005 |
716.3 |
864.5 |
|
2006 |
710.4 |
845.3 |
|
2007 |
680.9 |
843.5 |
|
2008 |
690.9 |
843.2 |
|
2009 |
859.7 |
934.6 |
|
2010 |
901.6 |
920.7 |
|
2011 |
1021.8 |
988.6 |
|
2012 |
1105.1 |
1055.3 |
|
2013 |
1287.8 |
1108.2 |
|
2014 |
1361.1 |
1171.0 |
|
2015 |
1498.8 |
1254.5 |
|
2016 |
1709.5 |
1373.0 |
Figure 5. Average rate of concussion-related physician visits by sex and age group in Ottawa from 2014 to 2016
Data Source and Notes for Figure 5
Patients of Ontario Physicians, Ontario Health Insurance Plan (OHIP) Approved Claim Files (2014-2016). Ontario Ministry of Health and Long-Term Care IntelliHEALTH Ontario. Extracted May 24, 2019.
- Data include Ottawa and Ontario-less-Ottawa patients who visited a doctor in Ontario for a concussion or head injury.
- OHIP diagnosis codes were used to categorize concussions (850) and head injuries (854).
Data Table for Figure 5
|
Age group |
Average female rate of concussion-related physician visits from 2014-2016 (per 100,000 females) |
Average male rate of concussion-related physician visits from 2014-2016 (per 100,000 males) |
|
<1 year |
3796.1 |
4505.9 |
|
1-9 years |
1774.8 |
2506.2 |
|
10-19 years |
3559.1 |
3565.6 |
|
20-29 years |
1309.1 |
1186.9 |
|
30-39 years |
1103.7 |
857.2 |
|
40-64 years |
1121.1 |
789.6 |
|
65+ years |
1490.4 |
1142.8 |