
Pregnancy and Maternal Health Data
For additional information on pregnancy and pregnancy resources in Ottawa, please refer to Parenting in Ottawa's website.
Births and Fertility Rates
In Ottawa:
- A total of 10,549 babies were born in 2024, up from 9,847 live births in 2023 (Figure 1).
- Fertility rates (number of live births per 1,000 females aged 15 to 49 years) consistently declined over the last decade, from 43.0 births per 1,000 females aged 15 to 49 years in 2013 to 36.4 births per 1,000 females aged 15 to 49 years in 2023 and rebounded slightly to 37.8 births per 1,000 females aged 15 to 49 years in 2024 (Figure 1). Fertility rates were lower in Ottawa than the Ontario average between 2013 and 2023. [1]
- Fertility rates were highest among women aged 30 to 34 years (98.6 births per 1,000 females), followed by women aged 35 to 39 years (69.0 births per 1,000 females) and women aged 25 to 29 years (46.2 births per 1,000 females) (Figure 2).
- The number and rate of live births among teenagers dropped 60% from 159 births (5.4 births per 1,000 females aged 15 to 19 years) in 2013 to 68 births (2.1 births per 1,000 females aged 15 to 19 years) in 2024 [2]. The rate of live births in Ottawa was lower than Ontario (2.8 births per 1,000 women 15 to 19 years in 2023). [1]
- In 2024, the majority (97.4%) of women delivered at a hospital, while 2.2% delivered at home and 0.4% delivered at a birth centre. [3]
Figure 1. Number of live births and fertility rates in Ottawa from 2013 to 2024
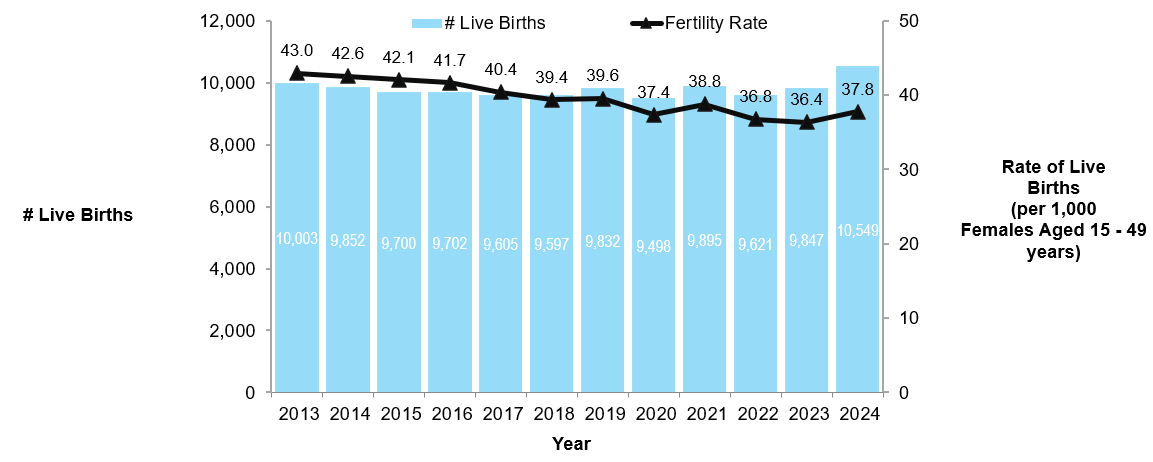 Number of live births and fertility rates in Ottawa from 2013 to 2024
Data Source and Notes for Figure 1
Ottawa Public Health. Better Outcomes Registry & Network (BORN) Ontario 2013-2024. Extracted: August 6, 2025
| Year | Number of live births | Fertility rate (births per 1,000 population women aged 15 to 49 years) |
|---|---|---|
| 2013 | 10,003 | 43.0 |
| 2014 | 9,852 | 42.6 |
| 2015 | 9,700 | 42.1 |
| 2016 | 9,702 | 41.7 |
| 2017 | 9,605 | 40.4 |
| 2018 | 9,597 | 39.4 |
| 2019 | 9,823 | 39.6 |
| 2020 | 9,498 | 37.4 |
| 2021 | 9,895 | 38.8 |
| 2022 | 9,621 | 36.8 |
| 2023 | 9,847 | 36.4 |
| 2024 | 10,549 | 37.8 |
Figure 2. Age-specific fertility rates in Ottawa by year, 2013 to 2024
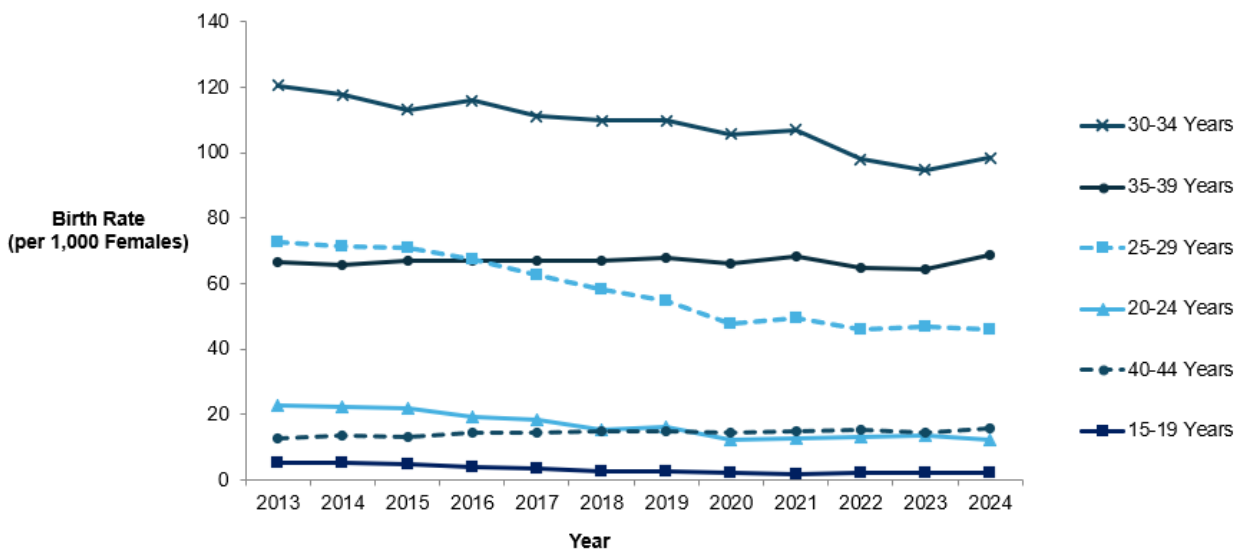 Age-specific fertility rates in Ottawa by year, 2013 to 2024
Ottawa Public Health. Better Outcomes Registry & Network (BORN) Ontario 2013-2024. Extracted: August 6, 2025
|
Birth rate (per 1,000 females)
|
Age 15-19 years |
Age 20-24 years |
Age 25-29 years |
Age 30-34 years |
Age 35-39 years |
Age 40-44 years |
|
2013 |
5.2 |
22.6 |
72.6 |
120.6 |
66.5 |
12.8 |
|
2014 |
4.9 |
22.1 |
71.5 |
117.6 |
65.9 |
13.8 |
|
2015 |
4.0 |
22.0 |
71.1 |
113.1 |
66.9 |
13.2 |
|
2016 |
3.6 |
19.5 |
67.5 |
116.1 |
67.2 |
14.4 |
|
2017 |
2.6 |
18.3 |
62.8 |
111.1 |
66.9 |
14.3 |
|
2018 |
2.7 |
15.4 |
58.5 |
109.9 |
67.1 |
14.8 |
|
2019 |
2.1 |
16.3 |
54.8 |
109.9 |
68.0 |
15.0 |
|
2020 |
1.9 |
12.4 |
48.0 |
105.8 |
66.1 |
14.4 |
|
2021 |
2.0 |
12.9 |
49.7 |
107.1 |
68.4 |
14.9 |
|
2022 |
2.1 |
13.2 |
46.0 |
98.0 |
65.1 |
15.6 |
|
2023 |
2.1 |
13.5 |
46.8 |
94.7 |
64.6 |
14.3 |
|
2024 |
5.2 |
12.2 |
46.2 |
98.6 |
69.0 |
15.8 |
Prenatal Class Attendance and Prenatal Care
In Ottawa:
- Three out of ten (31.5%) women attended a prenatal class during their last pregnancy in 2018. This was higher than the Ontario-less-Ottawa average of 22.2%. [4]
- During their first trimester of pregnancy, in 2024, 89% of women visited a health care provider, a decline from 2023 (92%) and lower than the Ontario-less-Ottawa average of 94%. [3]
Mental Health Concerns During Pregnancy
In Ottawa:
- In 2024, 21% of postpartum mothers self-reported a mental health concern during pregnancy to their health care provider, similar to Ontario-less-Ottawa (21%). Mental health concerns included anxiety (16.4%) and depression (8.9%). [3]
Smoking, Alcohol and Drug Use During Pregnancy
In Ottawa:
- One in fifty (2.1%) women who gave birth in 2024 reported smoking close to the time of their child’s birth, slightly lower compared to Ontario-less-Ottawa (3.1%). [3]
- Nearly one in fifty (1.7%) women who gave birth in 2024 reported drinking alcohol during their pregnancy, similar to Ontario-less-Ottawa (1.5%). [3]
- Approximately one in fifty (1.9%) women who gave birth in 2024 reported cannabis exposure during pregnancy, slightly lower compared to Ontario-less-Ottawa (2.9%). [3]
Pregnancy (Gestational) Weight Gain
In Ottawa:
- In 2024, 46% of women who gave birth had a ‘normal weight’ Body Mass Index (BMI, 18.5 – 24.9) before their pregnancy, 29% began their pregnancy with an ‘overweight’ BMI (25.0 – 29.9), 22% began their pregnancy with an ‘obese’ BMI (≥ 30.0), and 3% with an ‘underweight’ BMI (< 18.5). [3]
- In 2024, 46% of women who gave birth gained more than the recommended amount of weight during their pregnancies, as per the Canadian gestational weight gain recommendations, 30% gained within the recommended amount of weight, and 23% gained below the recommended amount of weight during pregnancy. [3]
- Nearly three out of five women who began their pregnancies as overweight (58%) or obese (58%) gained more than the recommended amount of weight during their pregnancies in 2024 (Figure 3).
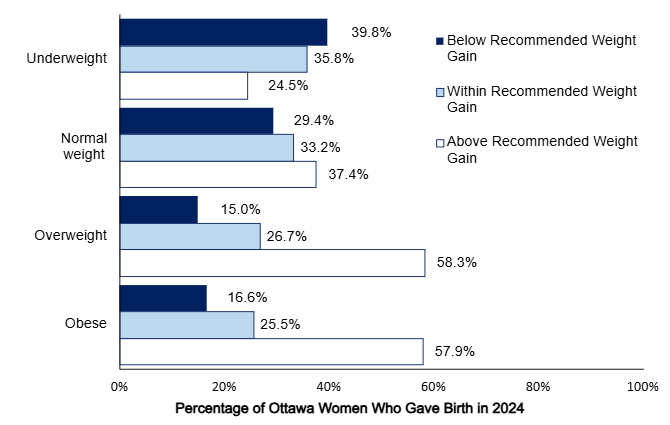 Gestational weight gain per Canadian recommendations by pre-pregnancy body mass index, Ottawa women who gave birth in 2024
Data Source and Notes for Figure 3
Ottawa Public Health. Better Outcomes Registry & Network (BORN) Ontario 2024. Extracted: August 6, 2025
- >5% of data were missing and were excluded from the calculations.
| Amount of gestational weight gain by Canadian recommendations | Underweight BMI pre-pregnancy | Normal weight BMI pre-pregnancy | Overweight BMI pre-pregnancy | Obese BMI pre-pregnancy |
|---|---|---|---|---|
| Below | 39.8% | 29.4% | 15.0% | 16.6% |
| Within | 35.8% | 33.2% | 26.7% | 25.5% |
| Above | 24.5% | 37.4% | 58.3% | 57.9% |
Birth Outcomes
- In 2018, the majority of births in Ottawa were [4]:
- singleton (96.7% vs. 3.2% multiple);
- born full-term (92.4%, vs. 7.6% preterm); and
- born with an appropriate weight for their gestational age (81.6%).
- Compared to Ontario-less-Ottawa in 2018, Ottawa had a lower proportion of small for gestational age babies born (Ottawa: 8.4% vs. Ontario-less-Ottawa: 9.8%) and a slightly higher proportion of large for gestational age babies born (Ottawa: 9.9% vs. Ontario-less-Ottawa: 9.3%). [4]
- Similar to the Ontario-less-Ottawa average (28.9%), in 2018, 29.1% of Ottawa women delivered via Cesarean section - the highest proportion over the past six years, of which, 57.3% were a first-time Cesarean section and 38.6% were repeat Cesarean sections. [4]
Notes on Gestational Age Weights
- Appropriate gestational age weight includes singleton live births between the 10th and 90th percentile based on Canadian standards.
- Small for gestational age weight includes singleton live births below the 10th percentile based on Canadian standards.
- Large for gestational age weight includes singletone live births above the 90th percentile based on Canadian standards.
Infant Mortality
Infant mortality is the death of an infant before their first birthday (days 0-364). The infant mortality rate is the number of infant deaths per 1,000 live births.
Neonatal mortality is the death of an infant aged 0-27 days. Post-neonatal mortality is the death of an infant aged 28-364 days.
In Ottawa:
- From 2013 to 2015, there was an annual average of 38.4 infant deaths. This includes an average of 32.3 neonatal deaths and an average of 6.3 post-neonatal deaths (Figure 4).
- Infant mortality rates in Ottawa have declined over the past 15 years from a high of 6.6 deaths per 1,000 live births from 1998-2000 to 3.9 deaths per 1,000 live births from 2013-2015. On average, infant mortality rates in Ottawa are lower than in the Ontario-less-Ottawa average (Figure 5).
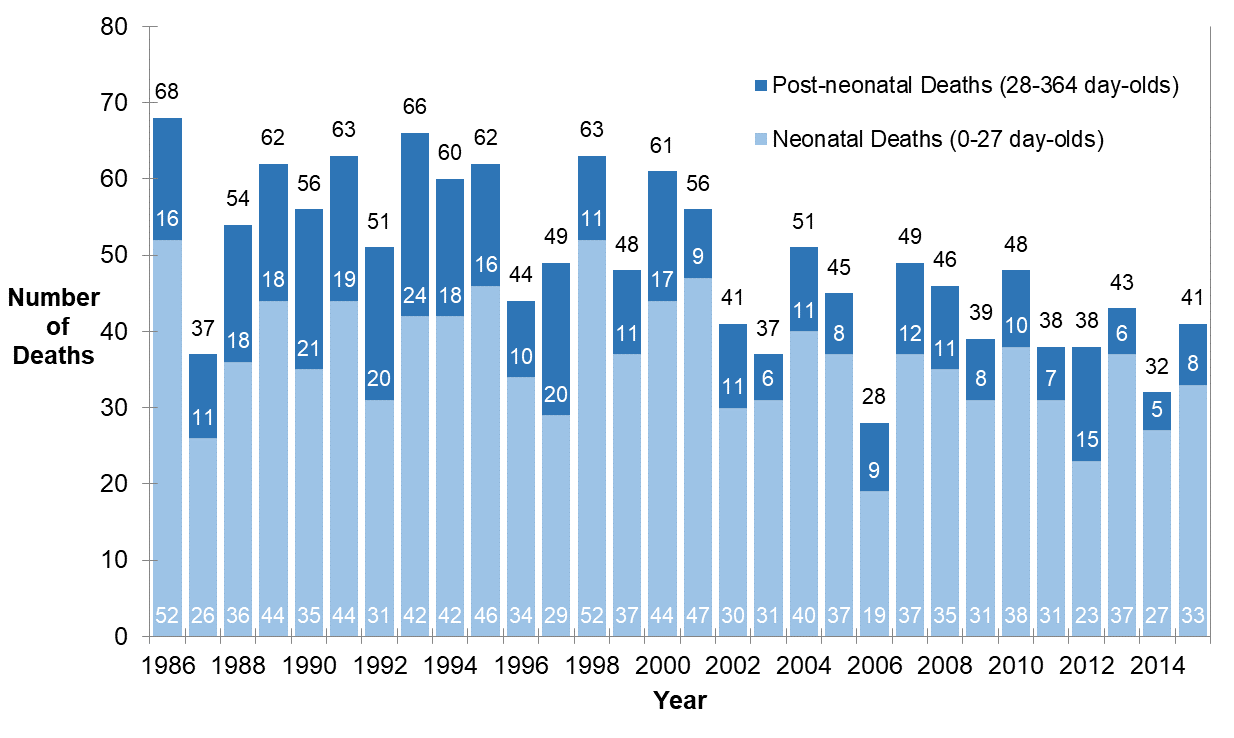 Number of infant deaths broken down by neonatal (age 0 to 27 days) and post-neonatal (age 28 days to 364 days) deaths in Ottawa from 1986 to 2015
Data Source and Notes for Figure 4
Ottawa Deaths, Ontario Mortality Data (1986–2015). Ontario Ministry of Health and Long-Term Care IntelliHEALTH Ontario. Extracted May 13, 2019.
- Deaths represent the residence (Ottawa) of the deceased and not where the death occurred; deaths occurring outside Ontario are not included.
- The annual number of deaths for neonates and for post-neonates is shown inside the bottom of each coloured bar and included in the data table below. The total annual number of deaths for all infants is shown at the top, above the post-neonatal death bar.
Number of infant deaths broken down by neonatal (age 0 to 27 days) and post-neonatal (age 28 days to 364 days) deaths in Ottawa from 1986 to 2015
Scroll right to view complete table
|
3 Year Intervals |
Number of neonatal deaths (deaths among 0-27 day-olds) |
Number of post-neonatal deaths (deaths among day 28 – 364 day-olds) |
Total number of infant deaths (deaths among 0 – 364 day-olds) |
|
1986 |
52 |
16 |
68 |
|
1987 |
26 |
11 |
37 |
|
1988 |
36 |
18 |
54 |
|
1989 |
44 |
18 |
62 |
|
1990 |
35 |
21 |
56 |
|
1991 |
44 |
19 |
63 |
|
1992 |
31 |
20 |
51 |
|
1993 |
42 |
24 |
66 |
|
1994 |
42 |
18 |
60 |
|
1995 |
46 |
16 |
62 |
|
1996 |
34 |
10 |
44 |
|
1997 |
29 |
20 |
49 |
|
1998 |
52 |
11 |
63 |
|
1999 |
37 |
11 |
48 |
|
2000 |
44 |
17 |
61 |
|
2001 |
47 |
9 |
56 |
|
2002 |
30 |
11 |
41 |
|
2003 |
31 |
6 |
37 |
|
2004 |
40 |
11 |
51 |
|
2005 |
37 |
8 |
45 |
|
2006 |
19 |
9 |
28 |
|
2007 |
37 |
12 |
49 |
|
2008 |
35 |
11 |
46 |
|
2009 |
31 |
8 |
39 |
|
2010 |
38 |
10 |
48 |
|
2011 |
31 |
7 |
38 |
|
2012 |
23 |
15 |
38 |
|
2013 |
37 |
6 |
43 |
|
2014 |
27 |
5 |
32 |
|
2015 |
33 |
8 |
41 |
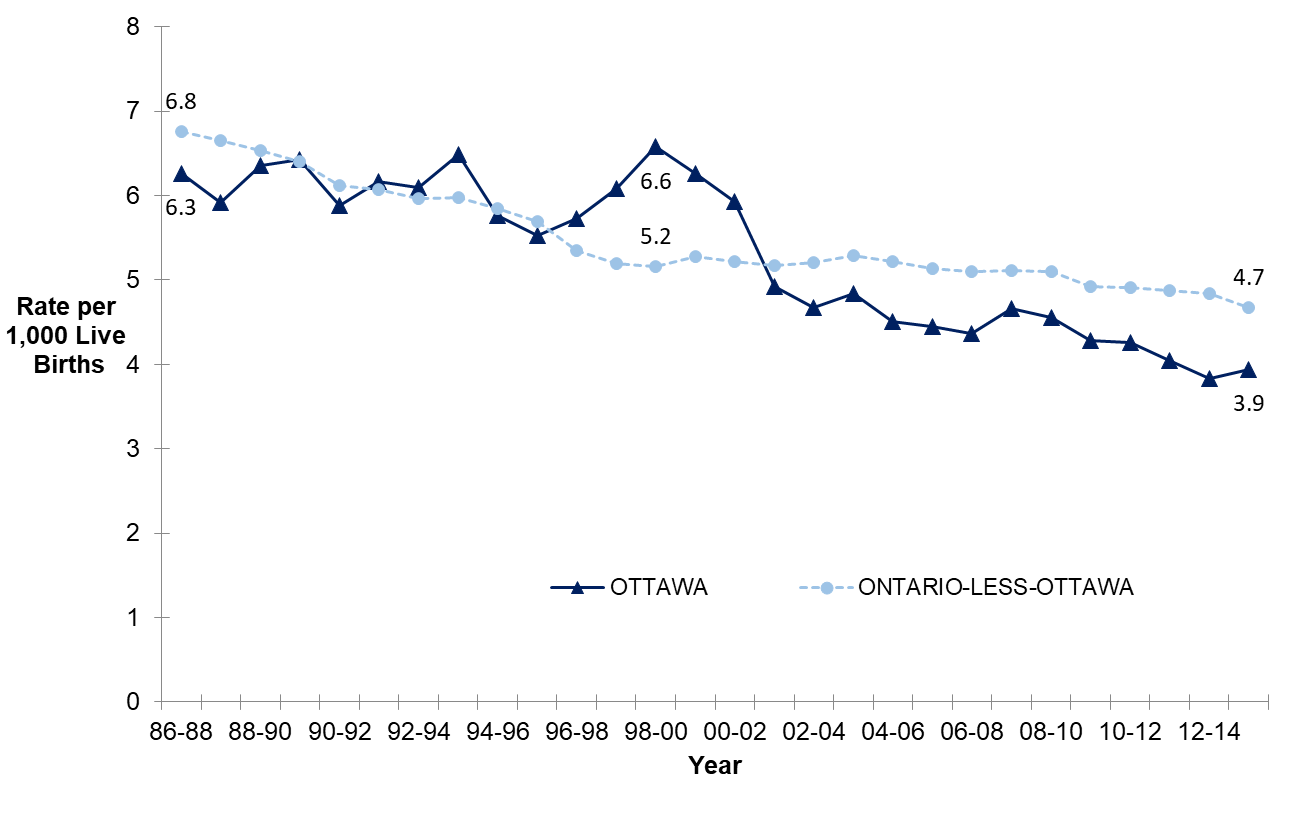 Infant mortality rate (3-year moving average) in Ottawa and Ontario-less-Ottawa from 1986 to 2015
Data Source and Notes for Figure 5
Ottawa Deaths, Ontario Mortality Data (1986–2015). Ontario Ministry of Health and Long-Term Care IntelliHEALTH Ontario. Extracted May 13, 2019.
Live Birth Registrations. Vital Statistics (1986-1996). Office of the Registrar General, Service Ontario. Ontario Ministry of Health and Long-Term Care IntelliHealth Ontario. Extracted May 13, 2019.
Live Births in Hospital. Discharge Abstract Database (1997-2012). Ontario Ministry of Health and Long-Term Care IntelliHealth Ontario. Extracted May 13, 2019.
Live Births. Better Outcomes Registry & Network (BORN) Ontario 2013-2015. Extracted: May 13, 2019.
Deaths represent the residence (Ottawa) of the deceased and not where the death occurred; deaths occurring outside Ontario are not included.
Infant mortality rate (3-year moving average) in Ottawa and Ontario-less-Ottawa from 1986 to 2015
|
3-Year Intervals |
Infant mortality rate (infant deaths per 1,000 live births), 3-year moving average for Ottawa |
Infant mortality rate (infant deaths per 1,000 live births), 3-year moving average for Ontario-less-Ottawa |
|
1986-88 |
6.3 |
6.8 |
|
1987-89 |
5.9 |
6.7 |
|
1988-90 |
6.3 |
6.5 |
|
1989-91 |
6.4 |
6.4 |
|
1990-92 |
5.9 |
6.1 |
|
1991-93 |
6.2 |
6.1 |
|
1992-94 |
6.1 |
6.0 |
|
1993-95 |
6.5 |
6.0 |
|
1994-96 |
5.8 |
5.8 |
|
1995-97 |
5.5 |
5.7 |
|
1996-98 |
5.7 |
5.3 |
|
1997-99 |
6.1 |
5.2 |
|
1998-00 |
6.6 |
5.2 |
|
1999-01 |
6.3 |
5.3 |
|
2000-02 |
5.9 |
5.2 |
|
2001-03 |
4.9 |
5.2 |
|
2002-04 |
4.7 |
5.2 |
|
2003-05 |
4.8 |
5.3 |
|
2004-06 |
4.5 |
5.2 |
|
2005-07 |
4.4 |
5.1 |
|
2006-08 |
4.4 |
5.1 |
|
2007-09 |
4.7 |
5.1 |
|
2008-10 |
4.6 |
5.1 |
|
2009-11 |
4.3 |
4.9 |
|
2010-12 |
4.3 |
4.9 |
|
2011-13 |
4.0 |
4.9 |
|
2012-14 |
3.8 |
4.8 |
|
2013-15 |
3.9 |
4.7 |
References
- Public Health Ontario. Reproductive Health Snapshot (2014-2023): Fertility rates (per 1,000 females of reproductive age). https://www.publichealthontario.ca/en/Data-and-Analysis/Reproductive-and-Child-Health/Reproductive-Health Accessed August 11, 2025.
- Ottawa Public Health. Ottawa births, Better Outcomes Registry & Network (BORN) Ontario 2013-2024. Extracted August 6, 2025.
- Ottawa Public Health. Better Outcomes Registry & Network (BORN) Ontario Information System 2024. Extracted 29 July 2025.
- Ottawa Public Health. Better Outcomes Registry & Network (BORN) Ontario Information System 2018. Extracted 12 September 2019.